
Every successful business, regardless of its size or industry, relies on accurate financial records to make informed decisions. Whether a company is a small startup, a growing e-commerce store, a professional service firm, or a large corporation, maintaining organized financial information is essential for long-term success. One of the most important tools that makes this possible is the Chart of Accounts (COA).
The Chart of Accounts serves as the foundation of a company’s accounting system. It is a structured list of all the financial accounts used by a business to record transactions and generate financial reports. Without a properly designed Chart of Accounts, businesses may struggle to track income, manage expenses, prepare tax returns, or understand their financial position.
Think of the Chart of Accounts as a filing cabinet for financial information. Every transaction that occurs within a business must be assigned to a specific account. These accounts help categorize assets, liabilities, equity, revenue, and expenses so that financial statements remain accurate and meaningful. When organized correctly, a Chart of Accounts provides a clear picture of where money comes from, where it goes, and how efficiently a business operates.
In the United States, businesses must maintain reliable accounting records to comply with federal and state tax requirements. A well-structured Chart of Accounts helps organizations meet these obligations while also providing valuable insights into profitability, cash flow, and operational performance.
This comprehensive guide explains everything business owners, accountants, bookkeepers, and finance professionals need to know about the Chart of Accounts. You’ll learn its purpose, structure, benefits, examples, best practices, and how to create an effective Chart of Accounts that supports business growth.
What Is a Chart of Accounts?
A Chart of Accounts (COA) is a complete list of all financial accounts used by a business to record accounting transactions. Each account represents a specific category of financial activity, such as cash, accounts receivable, sales revenue, rent expense, or loans payable.
The primary purpose of a Chart of Accounts is to organize financial data into meaningful categories that make accounting, reporting, and analysis easier. Every transaction recorded in the accounting system is assigned to one or more accounts within the Chart of Accounts.
For example, when a business receives payment from a customer, the transaction may be recorded in the Cash account and Sales Revenue account. When the business pays rent, the transaction may be recorded in the Cash account and Rent Expense account.
The Chart of Accounts acts as the backbone of the general ledger, which is the central repository of all accounting information. Without a Chart of Accounts, it would be impossible to prepare accurate financial statements or track business performance effectively.
Why Businesses Use a Chart of Accounts
Businesses use a Chart of Accounts for several important reasons:
Organized Financial Records
A Chart of Accounts ensures that every transaction is categorized consistently. This organization makes financial records easier to understand and maintain.
Accurate Financial Reporting
Financial statements such as the balance sheet and income statement rely on account balances from the Chart of Accounts. Proper categorization improves reporting accuracy.
Tax Compliance
Businesses must report income and expenses correctly when filing tax returns. A well-structured Chart of Accounts simplifies tax preparation and reduces errors.
Performance Analysis
Business owners can evaluate profitability, monitor expenses, and identify trends by reviewing account data.
Better Decision-Making
Access to accurate financial information enables management to make informed decisions about investments, budgeting, hiring, and expansion.
Who Uses a Chart of Accounts?
The Chart of Accounts is used by organizations of all sizes and industries, including:
- Small businesses
- Startups
- Retail companies
- Service providers
- Manufacturing firms
- Construction companies
- Nonprofit organizations
- Government agencies
- Large corporations
Regardless of industry, every organization benefits from having a structured accounting framework.
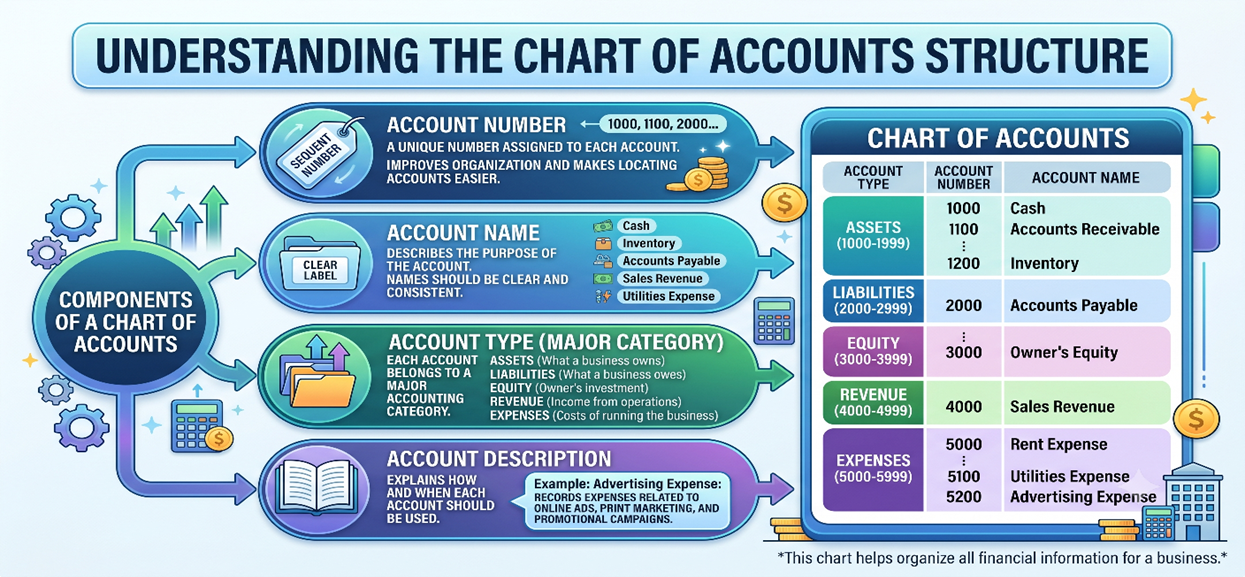
Understanding the Structure of a Chart of Accounts
A Chart of Accounts consists of several components that help organize financial information.
Most businesses assign a unique number to each account. Account numbers improve organization and make it easier to locate accounts.
For example:
| Account Number | Account Name |
| 1000 | Cash |
| 1100 | Accounts Receivable |
| 2000 | Accounts Payable |
| 4000 | Sales Revenue |
| 5000 | Rent Expense |
The account name describes the purpose of the account. Names should be clear and consistent.
Examples include:
- Cash
- Inventory
- Accounts Payable
- Sales Revenue
- Utilities Expense
Each account belongs to a major accounting category such as:
- Assets
- Liabilities
- Equity
- Revenue
- Expenses
Some businesses include descriptions that explain how and when each account should be used.
For example:
Account: Advertising Expense
Description: Records expenses related to online ads, print marketing, and promotional campaigns.
How Account Numbering Works
Most businesses organize accounts using a logical numbering system.
A common structure is:
| Account Category | Number Range |
| Assets | 1000–1999 |
| Liabilities | 2000–2999 |
| Equity | 3000–3999 |
| Revenue | 4000–4999 |
| Expenses | 5000–8999 |
This numbering system helps accountants quickly identify account categories.
For example:
- 1000 Cash
- 1100 Accounts Receivable
- 1200 Inventory
- 2000 Accounts Payable
- 2200 Payroll Taxes Payable
- 4000 Product Sales
- 4100 Service Revenue
- 5000 Rent Expense
- 5100 Utilities Expense
Using standardized numbering creates consistency across accounting records and reports.
The Five Main Categories of Accounts
Every Chart of Accounts contains five primary account categories.
Assets are resources owned or controlled by a business that provide future economic value.
Assets help businesses generate revenue and support daily operations.
Common asset accounts include:
Cash represents money held in bank accounts, savings accounts, and petty cash funds.
Accounts Receivable represents money owed by customers for goods or services already delivered.
Inventory includes products purchased or manufactured for resale.
These are expenses paid in advance, such as insurance premiums or rent.
Equipment includes machinery, computers, vehicles, and office furniture used in business operations.
A company purchases office equipment worth $5,000.
The equipment becomes an asset because it will provide value over several years.
Liabilities are obligations that a business owes to outside parties.
These obligations may include suppliers, lenders, employees, or government agencies.
Common liability accounts include:
Money owed to vendors for goods or services purchased on credit.
Amounts owed to banks or financial institutions.
Outstanding balances on business credit cards.
Employee taxes and payroll deductions that must be remitted to government authorities.
A company purchases inventory on credit from a supplier.
Until payment is made, the amount owed is recorded as Accounts Payable.
Equity represents the owner’s interest in the business after liabilities are deducted from assets.
The basic accounting equation is:
Assets = Liabilities + Equity
Common equity accounts include:
Funds invested by the owner into the business.
Profits that remain in the business after distributions.
Used by corporations to record shareholder investments.
Records amounts withdrawn by owners for personal use.
A business owner invests $50,000 to start a company.
The investment increases both Cash and Owner’s Capital.
Revenue represents income earned through business operations.
Revenue accounts show how money enters the business.
Common revenue accounts include:
Income earned from selling products.
Income earned from providing services.
Income earned from interest-bearing accounts or investments.
Income earned from leasing property.
A consulting firm completes a project and invoices a client for $10,000.
The amount is recorded as Service Revenue.
Expenses represent the costs incurred to operate a business.
These costs reduce profitability and are reported on the income statement.
Common expense accounts include:
Monthly office or warehouse rent payments.
Employee wages and salaries.
Electricity, water, internet, and phone bills.
Business insurance premiums.
Marketing and promotional costs.
Costs for paper, printer ink, and office materials.
A company pays $2,000 in monthly rent.
The payment is recorded as Rent Expense because it supports daily operations.
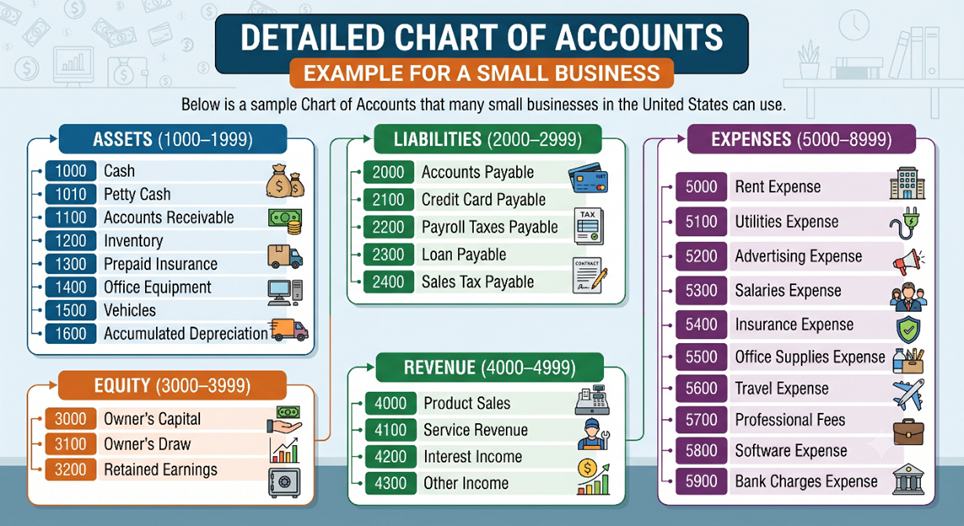
Detailed Chart of Accounts Example for a Small Business
How to Create a Chart of Accounts
Creating a Chart of Accounts (COA) is one of the most important steps in setting up an effective accounting system. A well-designed COA helps businesses organize financial information, generate accurate reports, and make informed decisions. While the structure may vary depending on the size and industry of a business, the process of creating a Chart of Accounts generally follows several key steps.
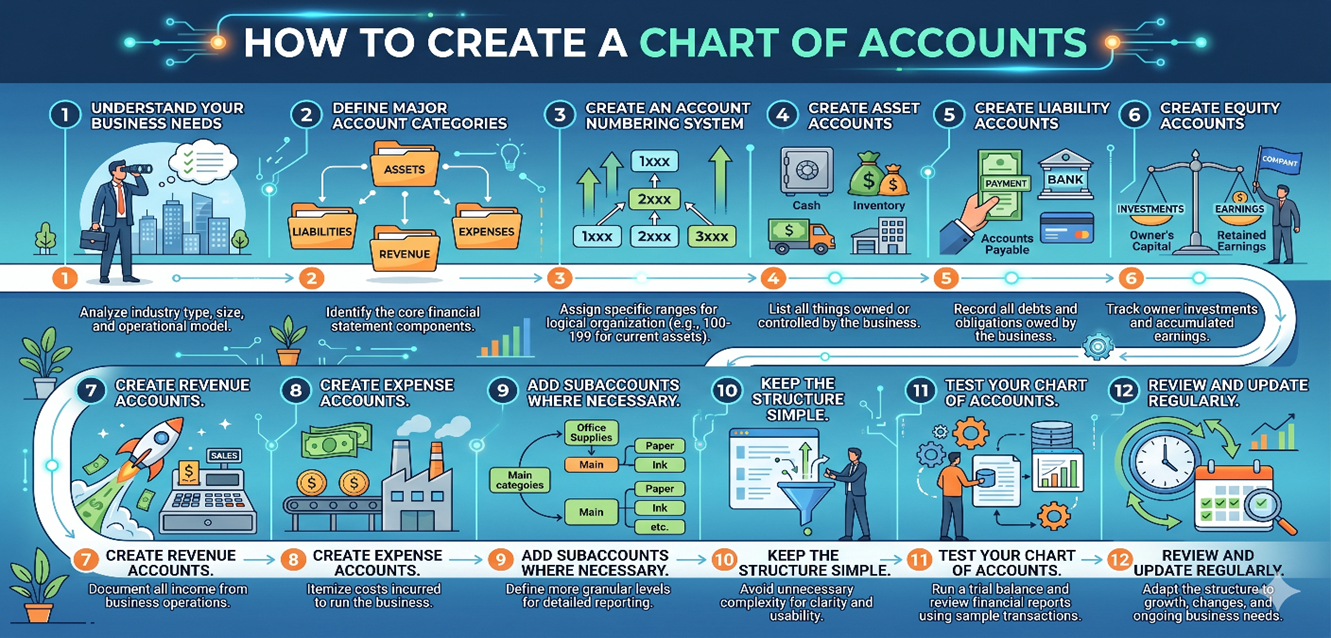
Step 1: Understand Your Business Needs
Before creating accounts, evaluate your business operations and reporting requirements. Consider the type of business you operate, the products or services you offer, the number of transactions you process, and the financial reports you need to generate.
For example, a retail business may need accounts for inventory and cost of goods sold, while a consulting firm may focus more on service revenue and professional expenses. Understanding these needs ensures that the Chart of Accounts accurately reflects business activities.
Step 2: Define the Major Account Categories
Every Chart of Accounts should include the five primary account categories:
Assets – Resources owned by the business, such as cash, accounts receivable, inventory, and equipment.
Liabilities – Obligations owed to others, including accounts payable, loans payable, and taxes payable.
Equity – Owner investments, retained earnings, and shareholder capital.
Revenue – Income earned from selling products or providing services.
Expenses – Costs incurred to operate the business, such as rent, salaries, utilities, and marketing expenses.
These categories form the foundation of the entire accounting system.
Step 3: Create an Account Numbering System
A numbering system makes accounts easier to organize and locate. Many businesses use the following standard structure:
| Account Category | Number Range |
| Assets | 1000–1999 |
| Liabilities | 2000–2999 |
| Equity | 3000–3999 |
| Revenue | 4000–4999 |
| Expenses | 5000–8999 |
Example:
- 1000 Cash
- 1100 Accounts Receivable
- 1200 Inventory
- 2000 Accounts Payable
- 3000 Owner’s Equity
- 4000 Sales Revenue
- 5000 Rent Expense
This numbering structure allows room for future growth and additional accounts.
Step 4: Create Asset Accounts
Asset accounts record everything the business owns or controls.
Examples include:
- 1000 Cash
- 1010 Petty Cash
- 1100 Accounts Receivable
- 1200 Inventory
- 1300 Prepaid Insurance
- 1400 Office Equipment
- 1500 Vehicles
Only create accounts that are relevant to your business operations. Avoid unnecessary complexity.
Step 5: Create Liability Accounts
Liability accounts track obligations owed to creditors, suppliers, and government agencies.
Examples include:
- 2000 Accounts Payable
- 2100 Credit Card Payable
- 2200 Payroll Taxes Payable
- 2300 Bank Loan Payable
- 2400 Sales Tax Payable
These accounts help monitor debts and ensure timely payments.
Step 6: Create Equity Accounts
Equity accounts represent the owner’s or shareholders’ interest in the business.
Examples include:
- 3000 Owner’s Capital
- 3100 Owner’s Draw
- 3200 Retained Earnings
- 3300 Common Stock
The exact structure depends on whether the business is a sole proprietorship, partnership, LLC, or corporation.
Step 7: Create Revenue Accounts
Revenue accounts track all sources of income.
Examples include:
- 4000 Product Sales
- 4100 Service Revenue
- 4200 Consulting Revenue
- 4300 Interest Income
- 4400 Other Income
Separating revenue streams provides better insight into business performance.
Step 8: Create Expense Accounts
Expense accounts record the costs of operating the business.
Common expense accounts include:
- 5000 Rent Expense
- 5100 Utilities Expense
- 5200 Advertising Expense
- 5300 Salaries Expense
- 5400 Insurance Expense
- 5500 Office Supplies Expense
- 5600 Travel Expense
- 5700 Professional Fees
- 5800 Software Expense
- 5900 Bank Charges
These accounts help management monitor spending and control costs.
Step 9: Add Subaccounts Where Necessary
Subaccounts provide additional detail without cluttering the main account structure.
For example:
5100 Utilities Expense
- 5110 Electricity Expense
- 5120 Water Expense
- 5130 Internet Expense
- 5140 Telephone Expense
5200 Advertising Expense
- 5210 Google Ads Expense
- 5220 Facebook Ads Expense
- 5230 Print Advertising Expense
Subaccounts improve reporting and analysis while maintaining organization.
Step 10: Keep the Structure Simple
One of the most common mistakes businesses make is creating too many accounts. A Chart of Accounts should provide useful detail without becoming difficult to manage.
For example, instead of creating separate expense accounts for every office supply item, use a single “Office Supplies Expense” account.
A simple and organized structure improves accuracy and reduces bookkeeping errors.
Step 11: Test Your Chart of Accounts
Before fully implementing the Chart of Accounts, review it to ensure:
- All major business activities are covered.
- Accounts are logically organized.
- Account names are clear and descriptive.
- There are no duplicate accounts.
- Reports can be generated easily.
Testing helps identify issues before large numbers of transactions are recorded.
Step 12: Review and Update Regularly
A Chart of Accounts should evolve as the business grows.
Consider updating the COA when:
- New products or services are introduced.
- Additional revenue streams are created.
- New reporting requirements arise.
- Business operations expand.
- Regulatory or tax requirements change.
Many businesses review their Chart of Accounts annually to ensure it continues to meet their needs.
Best Practices When Creating a Chart of Accounts
- Use a logical numbering system.
- Keep account names clear and consistent.
- Avoid creating unnecessary accounts.
- Use subaccounts for detailed tracking.
- Align accounts with financial reporting needs.
- Review the structure regularly.
- Ensure consistency across all bookkeeping activities.
- Utilize accounting software to automate account management.